Graph the points, you get a parabola - all points are on the convex hull.
Note that this works because of the function chosen. For example this will not work
on a sin curve.
Homework review
Ceiling function (round up) ...
Floor function (round down) ...
Voronoi Diagrams
Voronoi Diagrams
The concept is more than a century old, discussed in 1850 by Dirichlet
and in 1908 in a paper of Voronoi. A Voronoi Diagram records everything one would
want to know about proximity to a set of points (or more general objects).
Applications:
The post office problem
Where pizza parlors are located
Air rescue stations
Given the coordinates of a point quickly tell which station should respond. The closest
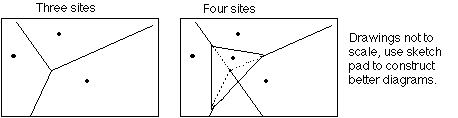
one should respond. Each site should get a portion of the plane to cover.
One site - covers the whole world
Two sites - each sites cover half plane
Slides:
Voronoi Diagrams:
Applications from Archeology through Zoology
Archeology
and Anthropology
- Identify the parts of a region under the influence of different neolithic clans,
chiefdoms, ceremonial centers, or hill forts. (Singh 1976, Renfrew 1973, Hammond
1972, Cunnliff 1971)
Astronomy
- Identify clusters of stars and clusters or galaxies. (Icke and Van de Weygaert
1987)
Biology, Ecology, Forestry
- Model and analyze plant competition. (Brown 1965 "area potentially available to
a tree", Mead "plant polygons" 1966, Firbank and Watkinson 1987)
Cartography
- Piece together satellite photographs into large "mosaic" maps. (Manacher and Zobrist
1983)
Crystallography
and Chemistry
- Study chemical properties of metallic sodium (Wigner and Seitz "Wigner-Seitz regions"
1933) Modeling alloy structures as sphere packings (Frank
and Kaspar "domain of an atom" 1958).
Finite Element Analysis
- Generating finite element meshes which avoid small angles (Baker 1989, Chew 1989)
Geography
- Analyzing patterns of urban settlements. (Boots 1975)
Geology
- Estimation of ore reserves in a deposit using information obtained from bore holes.
(Boldyrev 1909, Davis and Harding 1920-21, 1923) Modeling crack patterns in
basalt due to contraction on cooling (Stiny 1929, Smalley 1966)
Marketing
- Model market areas of US metropolitan areas (Bogue 1949), market area extending
down to individual retail stores (Snyder 1962, Dacey 1965).
Mathematics -
Study of positive definite quadratic forms in two- and three- dimensions (Dirichlet
"Dirichlet Tessellation" 1850) and m-dimensions (Voronoi "Voronoi Diagram" 1908)
Metallurgy
- Modeling "grain growth" in metal films (Johnson and Mehl 1939, Evans 1945, Glass
1973, Frost and Thompson 1987, Schaudt and Drysdale 1991, many
others)
Meteorology
- Estimate regional rainfall averages, given data at discrete rain gauges. (Thiessen
1911, Horton 1917, Whitney 1929)
Pattern Recognition
- Find simple descriptors for shapes that extract 1-D characterizations from 2-D
shapes. (Blum "Medial Axis" or "Skeleton" of a contour 1967, 1973)
Physiology
- Analysis of capillary distribution in cross-sections of muscle tissue to compute
oxygen transport ("capillary domains:"). (Hoofd et.al.
1985, Egginton et.al.
1989)
Robotics
- Path planning in the presence of obstacles (O'Dunlaing, Sharir, and Yap 1986)
Statistics and Data Analysis
- Analyze statistical clustering (Sibson 1980), "Natural Neighbors" interpolation
(Sibson 1981)
Zoology
- Model and analyze the territories of animals. (Tanemura and Hasegawa 1980)
Delaunay Triangulations - see diagram page 174--176
A triangulation of a set of points: connect any 2 points, connect another point using
any edge as long as it doesn't cross an already existing edge.
Whenever you triangulate ....to be continued
Supplemental Notes:
Leonard Euler in 1758 noted that the sum of the number of vertices and faces is always
two more than the number of edges in all polyhedra.
Euler's formula: Let V, E, and F be the number of vertices, edges, and faces respectively
of a polyhedron then V - E + F = 2
A formal proof of Euler's formula is given on page 119.
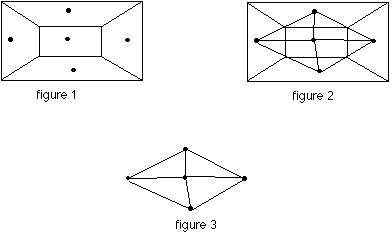
Given a graph with 5 regions, as in figure 1 below, a triangulation is found by:
place a vertex (point) in each region.
connecting two regions if they have a common edge as shown in figure 2.
the complete triangulation is shown in figure 3.